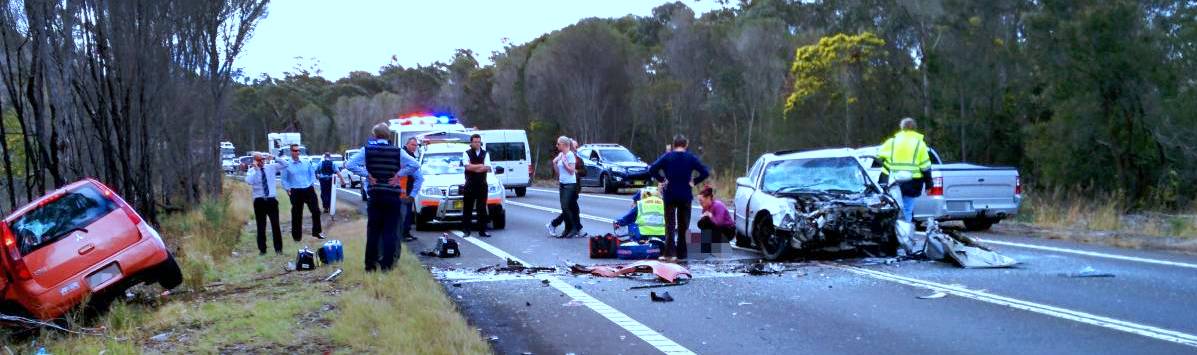
 Imagine if our nation was providing a defence force to combat war overseas, and that 25 soldiers were dying and 700 were being seriously injured each week - week after week, year after year. Imagine if there was no end in sight, and the wartime fatalities had increased in the last calendar year compared to the year before. The public and political pressure to end these mass casualties would be immense.
Imagine if there were 5 Boeing 737 crashes every week in Australia, with 25 passengers dying and 700 being seriously injured each week. The public outcry would be enormous, the effects on our nation soul destroying. Every effort would be made to stem this tide of death and injury. Imagine if there was an epidemic that consistently, year after year, was the leading cause of casualty in our population for 1-14 year olds. Imagine if it was the 2nd highest cause of death and injury in our young people between the ages of 15-24. The forces mobilised to counteract this epidemic would be enormous. Imagine the effects on health systems if our hospitals were dealing with the injured from these plane crashes, war events or epidemics – 700 people each week - reaching the emergency doors with serious injuries, enduring lengthy hospital stays and for some a lifetime of disability. Imagine the strain on our disability services and community support structures if our communities were dealing with these injured people –700 people per week - some requiring extensive and costly lifetime support. Imagine the consequences of these deaths and injuries on our communities – the 25 deaths each week resulting in outpourings of grief from our families and communities, and the 700 people each week who are released from hospital, some to be cared for by families and communities over the longer term. Imagine if the annual cost to our economy of these plane crashes, wartime efforts or epidemics was estimated to be over $27 billion in 2011, and had risen to at least $32 billion by 2016, and continued to increase each year over and above CPI. This is more than Australia’s current annual defence budget of $31.9 billion (Department of Defence, 2015). The political and social pressure to solve this problem would be enormous. This is the road trauma REALITY 25 people dead and 700 seriously injured every week in Australia. Week after week. Year after year. And Rising. The impact of road trauma is all-encompassing, impacting the full spectrum of the political agenda. A much stronger focus on saving lives and injuries on our roads, covering all age groups and user groups, all the factors in roads and vehicles, and including all facets of road crashes such as trauma services and post-crash care, would have a major impact on Australia’s economic and social well-being. There are many simple and cost effective solutions. The Australasian College of Road Safety (ACRS) is calling on our politicians to provide strong leadership and support for a coordinated approach towards road trauma reductions. The above facts are included in the ACRS submission to Federal Parliamentarians. I urge our State Parliamentarians to recognise these facts and also provide strong leadership and support for a coordinated approach towards road trauma reductions in Western Australia.
1 Comment
 Have you ever traveled through a school zone and spent more time looking at your speedometer than the road ahead?
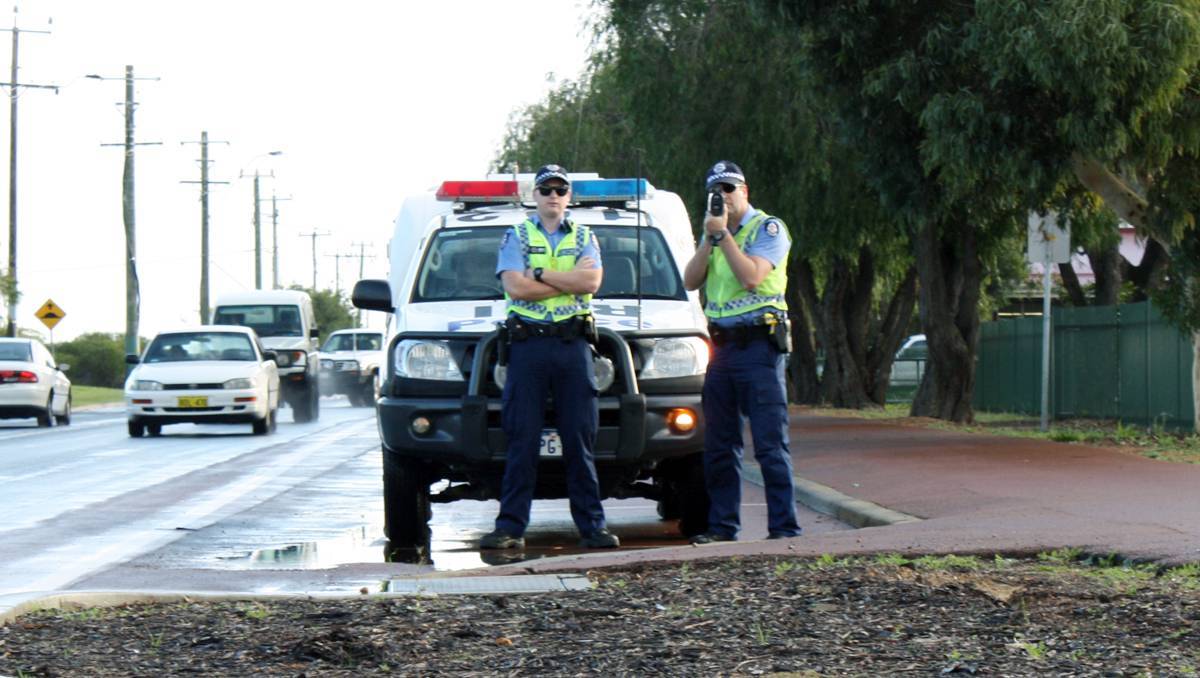
Have you thought 'This can't be good - I should be looking where I'm going"? A recent study by researchers at the University of Western Australia has raised concerns that strict speed enforcement could have a detrimental impact on road safety because drivers are dedicating more attention to monitoring their speed than detecting hazards. The researchers used a driving simulator to test whether reducing the speed enforcement thresholds would impact on a driver's mental and visual abilities. 84 participants were told they could be fined for driving 1 km/h, 6 km/h or 11 km/h over a 50 km/h speed limit and the researchers measured their response to small red dots which appeared in their peripheral vision. The study found those who were given a 1 km/h threshold were less likely to detect objects outside their immediate line of sight. An aspect that was not reported in the study is how long it takes the human eye to readjust to the different light and focal length conditions associated with changing focus from the speedometer to the road outside. All of this supports the view that it is better to create slow speed environments outside schools through environmental features than to rely on strict enforcement. Drivers will travel at low speeds when everything outside tells them that slow speed is appropriate.
i3 consultants WA is pleased to announce that it's Principal and Senior Road Safety Auditor, David Wilkins, has recently had his 100th Road Safety Audit as a Team Leader approved and accredited on the official IPWEA/ MRWA website at:
http://ipwea.asn.au/portal/
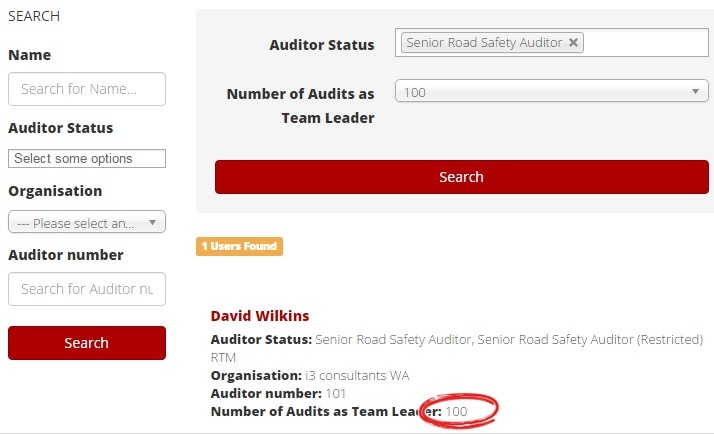
David is the first and only accredited Senior Road Safety Auditor in WA to have reached this milestone and it reflects his considerable experience in road safety engineering of over 30 years both in Australia and the UK.
Please feel free to contact David directly at dwilkins@i3consultants.com should you require high quality road safety engineering consultancy services in the future. Every year, 1.25 million people are killed in road crashes and up to 50 million are seriously injured. Road crashes kill more people than malaria or tuberculosis and are among the ten leading causes of death. Their economic cost is estimated at 2-5% of GDP in many countries. To stem the road death epidemic, the United Nations have set the target of halving traffic fatalities by 2020.  A new report, written by a group of international road safety experts, provides leaders in government, administrations, business and academia with emerging best practices and the starting point to chart their own journeys towards a Safe System. This report calls for a paradigm shift on road safety policy to achieve a drastic reduction in the number of road deaths. It reviews strategies employed by countries with outstanding road safety performance based on the vision of “zero road deaths” and underpinned by a “Safe System” approach to road safety.
This report describes a paradigm shift in road safety policy, being led by a handful of countries, according to the principles of a Safe System. A Safe System is based on the premise that road crashes are both predictable and preventable, and that it is possible to move towards zero road deaths and serious injuries. This, however, requires a fundamental rethink of the governance and implementation of road safety policy. (You can read the report via the following link. An OECD Library subscription is required to download a PDF version) 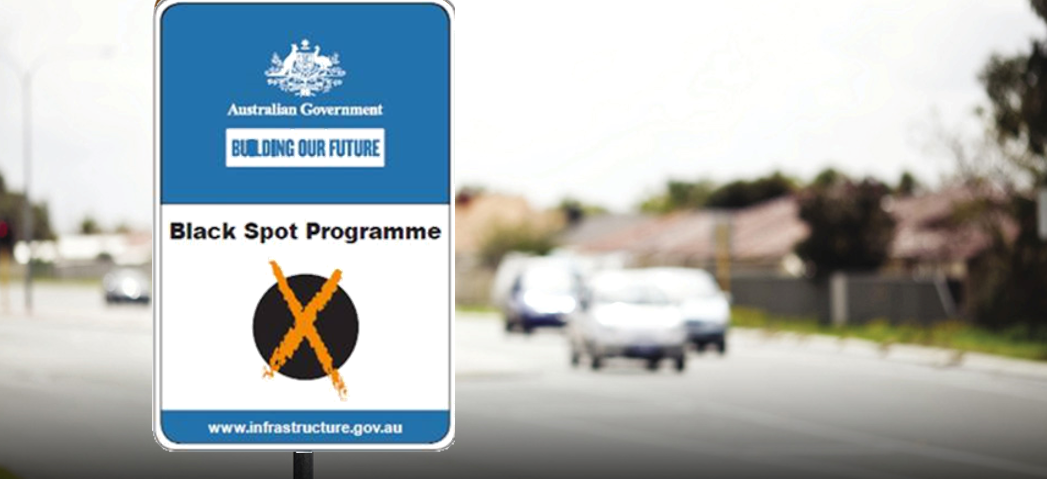 This week the Australian Government announced that Senators Dean Smith and Nigel Scullion have been reappointed as respective Chairs of the Western Australian and Northern Territory Black Spot Consultative Panels.
Each Senator will work with a range of community and road user groups, industry members and government agencies to allocate funding under the Australian Government’s Black Spot Programme toward some of the most dangerous roads in their respective states and territories. The Black Spot Programme is part of the commitment to reduce crashes on Australian roads. Road crashes are a major cost to Australians every year. Black Spot projects target those road locations where crashes are occurring. By funding measures such as traffic signals and roundabouts at dangerous locations, the programme reduces the risk of crashes. Programmes of this sort are very effective, saving the community many times the cost of the relatively minor road improvements that are implemented. The Australian Government has committed $500 million to the Black Spot Programme from 2014-15 to 2018-19, which includes an additional $200 million over two years from 2015-16 to improve road safety across the nation. Funding is mainly available for the treatment of Black Spot sites with a proven history of crashes. Project proposals of this sort should be able to demonstrate a benefit to cost ratio (BCR) of at least 2. However, to assist Proponents to identify additional projects during the financial years 2015-16 and 2016-17 a BCR of at least 1 will be accepted for these financial years only. For discrete sites (for example, an intersection, mid-block or short road section) the minimum eligibility criterion during the financial years 2015-16 and 2016-17 will be a history of at least two casualty crashes over five years and during the financial years 2014-15, 2017-18 and 2018-19 a history of at least three casualty crashes over five-years. " Trips by car now account for at least half of all distances traveled by 10-14 year olds and this shift is believed to account for the fact that more children are killed today as car passengers than in any other form of transport. "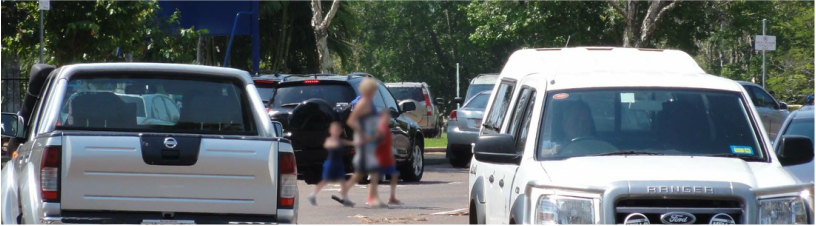 Children are considered vulnerable road users because up to the age of approximately ten years they may not be developmentally ready (i.e. they do not have the physical and cognitive skills) to make safer judgments and choices of their own about traffic. Parents, carers and educators need to be aware of the skills of the children and plan road safety awareness in accordance with the child’s development.
Child pedestrians are at risk because physically they have:
Child pedestrians are at risk because cognitively they have:
Children may also be at risk because of their:
Protective pedestrian behaviours To reduce the risk to child pedestrians, classroom and parent education should focus on children:
Addressing the above issues by driving children to and from school is a common reaction by parents. However, this decision is often made without consideration of the full facts regarding car travel. Trips by car now account for at least half of all distances traveled by 10-14 year olds and this shift is believed to account for the fact that more children are killed today as car passengers than in any other form of transport. It should also be remembered that trips by car have an element of walking involved and this walking trip at the school end is often in a car park or drop-off/ pick-up environment with high risks associated with increased traffic and parking manoeuvres, including reversing. Most crashes involving child pedestrians and vehicles are the result of errors made by children. Children under ten years of age do not have the necessary cognitive and perceptual skills to negotiate roads without adult supervision. Most cycling injuries occur on public roads and don’t involve another vehicle, but occur when children fall off their bikes. For young cyclists a footpath or shared path is the best place to ride. All-age cycling on footpaths is legal in Western Australia. Anyone can cycle on a footpath, but there are some conditions. See the Road Safety Commission website for more details. 
Many authorities attempt to address road safety issues around schools through the Road Safety Audit process however this process is generally limited to assessment of the layout of the school frontage roads.
Parents are concerned for the safety of their child between home and school, not just around the school, and hence the failure to assess the safety of the trip can result in more trips to and from the school by car than is preferred. But how can we assess the trip?
In my experience, the best approach is to do both, using the survey forms within the School Edition of the "Guidelines for Road Safety Around Schools", available to download at:
www.roadwise.asn.au/road-safety-sound-schools.aspx
My approach to undertaking a 'Safe Routes to School Assessment' is to:
NOTE – Schools are sensitive areas I recommend obtaining a letter from the Principal indicating you have been authorised to undertake surveys and take photographs around the school and have this with you during your work. Using the above methodology I have been able to determine the following characteristics of the school trip for a particular primary school in Darwin. By undertaking this at several school sites, I have been able to compile a database of characteristics for different schools in different locations, which in turn allows me to identify whether or not a particular school could do better in terms of single car, walking, cycling and public transport trips. 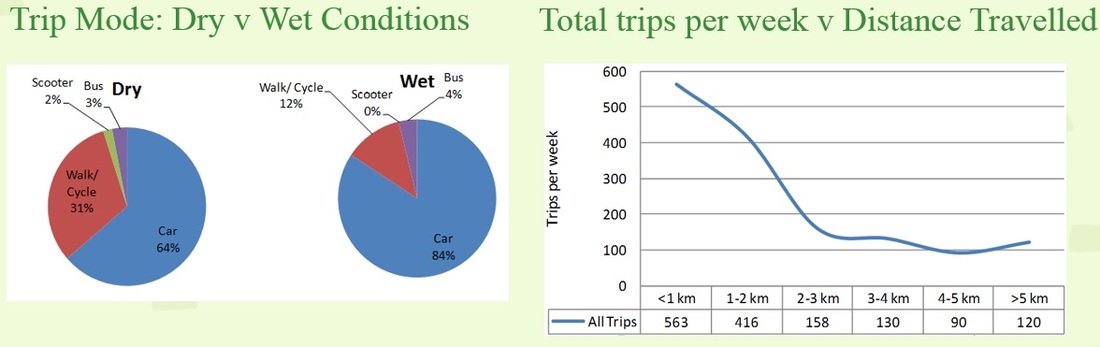
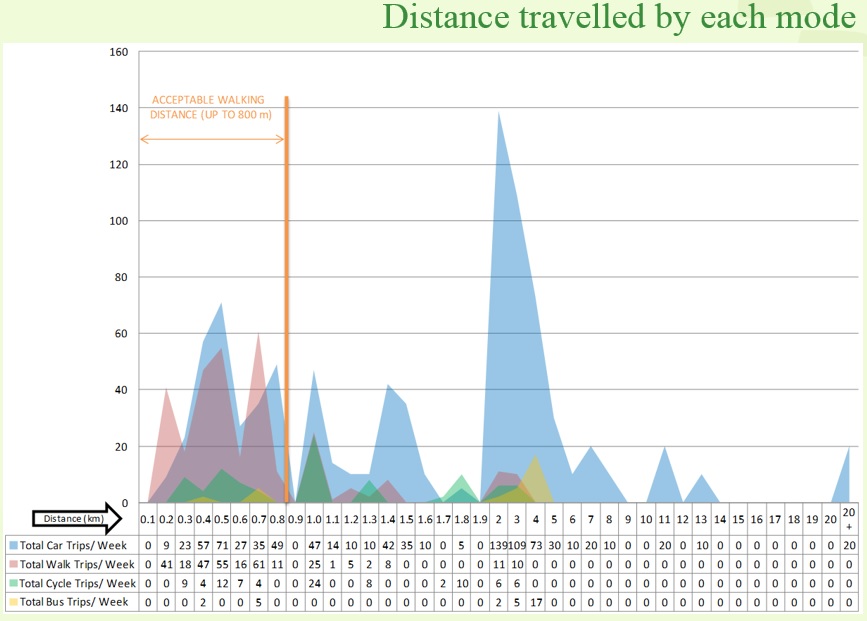
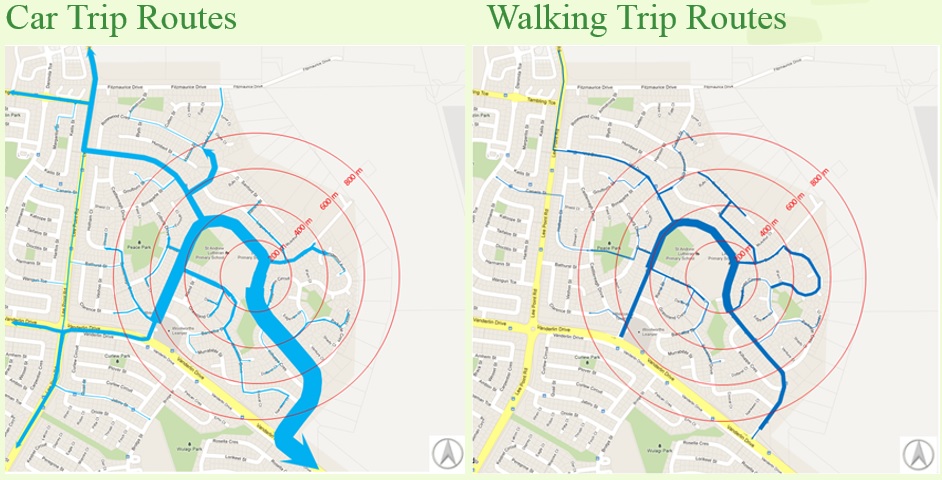
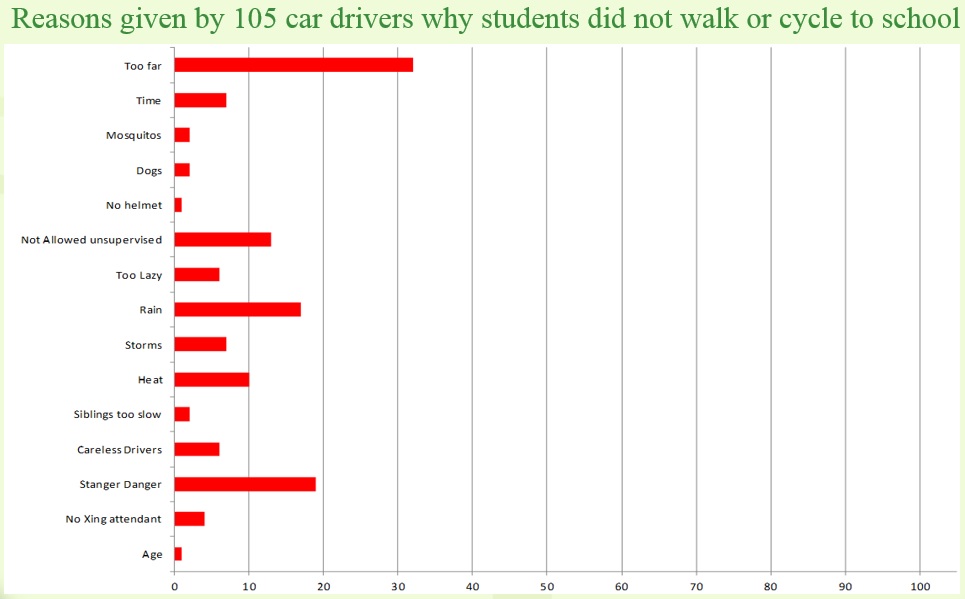
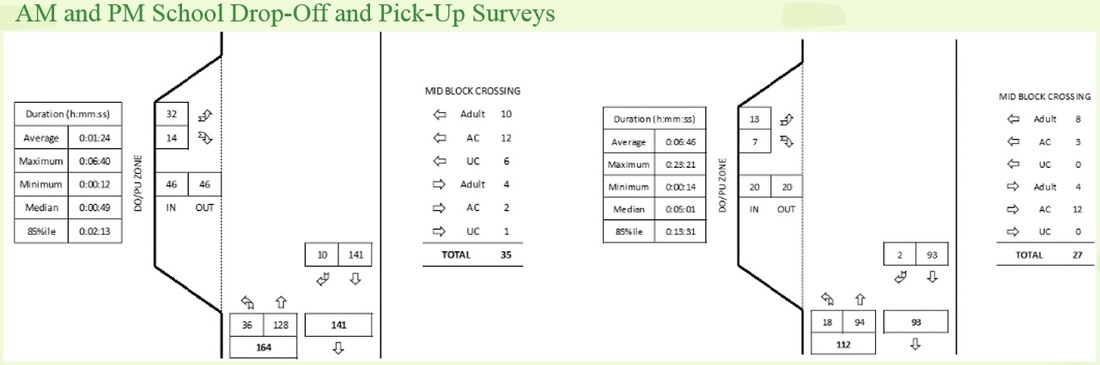
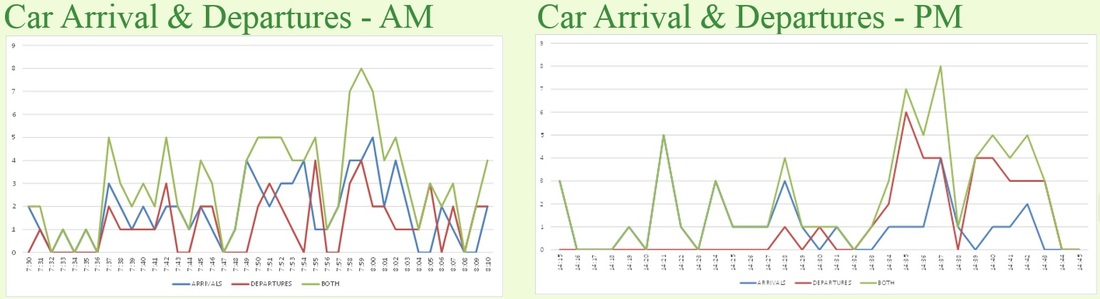
The above data revealed that the main problem was not so much the road layout but the high number of car trips to and from school. A typical road safety audit would most likely have identified a need for more drop-off/ pick-up bays and more parking bays which in turn would have resulted in more car trips.
In summary, obtaining behavioral data can significantly change the recommended remedial measures when assessing school sites and hence I strongly recommend that this be undertaken as part of a 'Safe Routes to Schools' assessment as opposed to a regular Road Safety Audit.
|
AuthorDavid Wilkins, Principal & Senior Traffic Engineer. Archives
August 2023
Categories
All
|
 RSS Feed