|
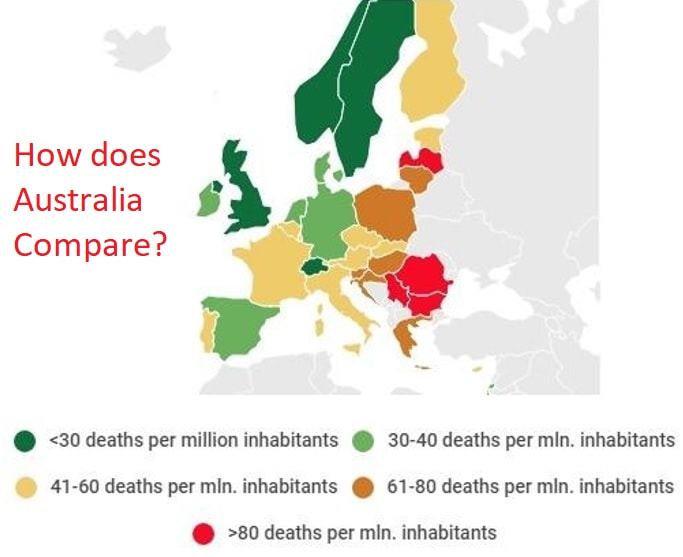
Last week I posted data showing how WA and Australia compares against European Countries in terms of fatal crashes per million people.
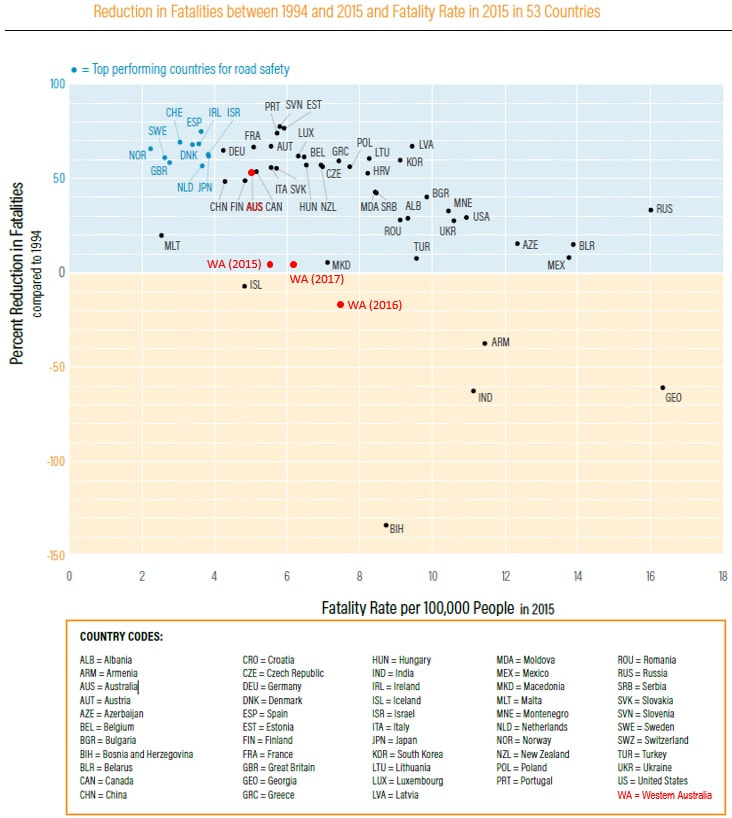
Above is a graph showing how Australia compared with 52 Countries in terms of the reduction in Fatalities per 100,000 people from that recorded in 1994 and 2015. I have added WA data to this showing 2015, 2016 and 2017 reductions. There have been many comments regarding the use and relevance of using crash rates per population numbers with suggestions that I should be using crash rates per million vehicle km's travelled. Ideally crash rates for all Countries should be published in three different standard formats (per population, per km's travelled and per licensed vehicles for example). The reality is that each Country, and even some states, calculate million vehicle kms travelled differently with most based on a combination of the number of vehicles and the amount of fuel sold. The only consistent crash rates that I have been able to find is per 100,000 or million people. But all of this distracts from the stark reality that WA has a shocking road safety record regardless of how you look at it. To bring about a significant change in this we need a significant change in how we are tackling it.
0 Comments
Below is a map of road deaths per million inhabitants in Europe in 2016. Can you guess the rate for Australia? In Australia it is 54. In Western Australia it is 79.
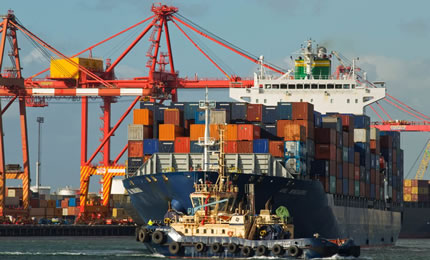
That puts us on par with Poland, Lithuania, Latvia, Hungary, Croatia, Slovenia, Greece and Bulgaria. If Australia had the political will to bring the rate down to less than 30 that would save 725 lives every year in Australia (and 75 in WA). It would also reduce serious injury crashes by around 6,000 every year in Australia. Is it too much to ask just one politician in Australia to respond and make this his or her mission for 2018? If you know one - please send them this link. There is a wealth of experience and expertise in the engineering and other professions to help achieve this target. We just need the right environment and culture to work in. The WA Government has implemented financial incentives to reduce truck congestion and get more freight on rail to Fremantle Port.
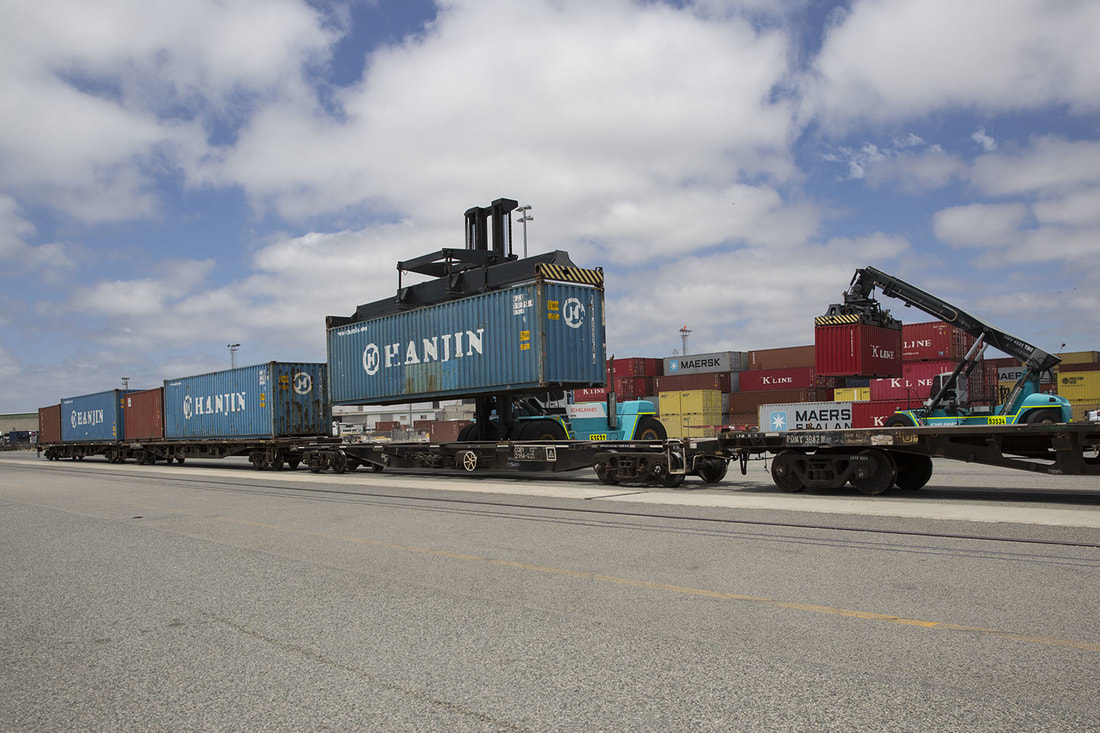
From 1st January, the container rail subsidy has increased from $30 to $50 per Twenty-foot Equivalent Unit (TEU). The plan aims to reduce truck traffic on roads around Fremantle Port by encouraging more freight on rail. The WA Government’s integrated plan for freight and trade includes a target to boost rail mode share to 20 per cent – an increase of approximately five per cent. The subsidy will be paid for all loaded containers that move between North Quay Rail Terminal (NQRT), Forrestfield and Kwinana, as well as for containers filled with hay received by rail at NQRT for export. The Westport Taskforce has released Westport: Preparing for the Strategy – the WA Government’s first discussion paper for delivering its Outer Harbour vision.
The discussion paper can be downloaded here. The taskforce is inviting stakeholders to join the conversation on key factors that it believes should be investigated in the development of the Westport Strategy. Feedback on the discussion paper will be accepted until 5.00pm on 31 January, 2018 and can be submitted online. A consultation summary will be published towards the end of February 2018. It will summarise the comments received and outline the updated Westport methodology. More information can be found at https://www.transport.wa.gov.au/projects/westport-port-and-environs-strategy.asp |
AuthorDavid Wilkins, Principal & Senior Traffic Engineer. Archives
August 2023
Categories
All
|


 RSS Feed