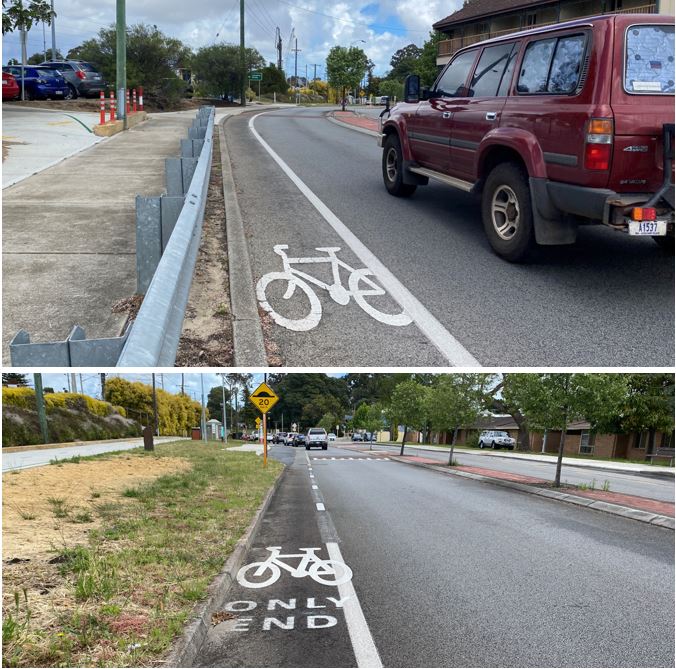
 First of all you need to allow 1.0 m for the 'cyclist envelope'. The minimum width between the 'cyclist envelope' and passing trucks is then 1 m for 60 km/h, 1.5 m for 70 km/h, 1.5 m for 80 km/h and 2.0 m for 100 km/h.
If you can't fit the logo in then its safe to say it's not right. Pedestrians and cyclists are the most vulnerable road users. We should design for them first and then design for cars and trucks around them, not the other way around. Cycle lane design guidance can be found in Austroads Guide to Road Design Part 3: Geometric Design (2021) and Guide to Road Design Part 6A (2017) - available to download for free from Publications | Austroads. Austroads 'Cycling Aspects of Austroads Guides', 'Australian National Cycling Strategy', 'Low Cost Interventions to Encourage Cycling' and 'Cycling Infrastructure Case Studies' also provide some useful guidance.
4 Comments
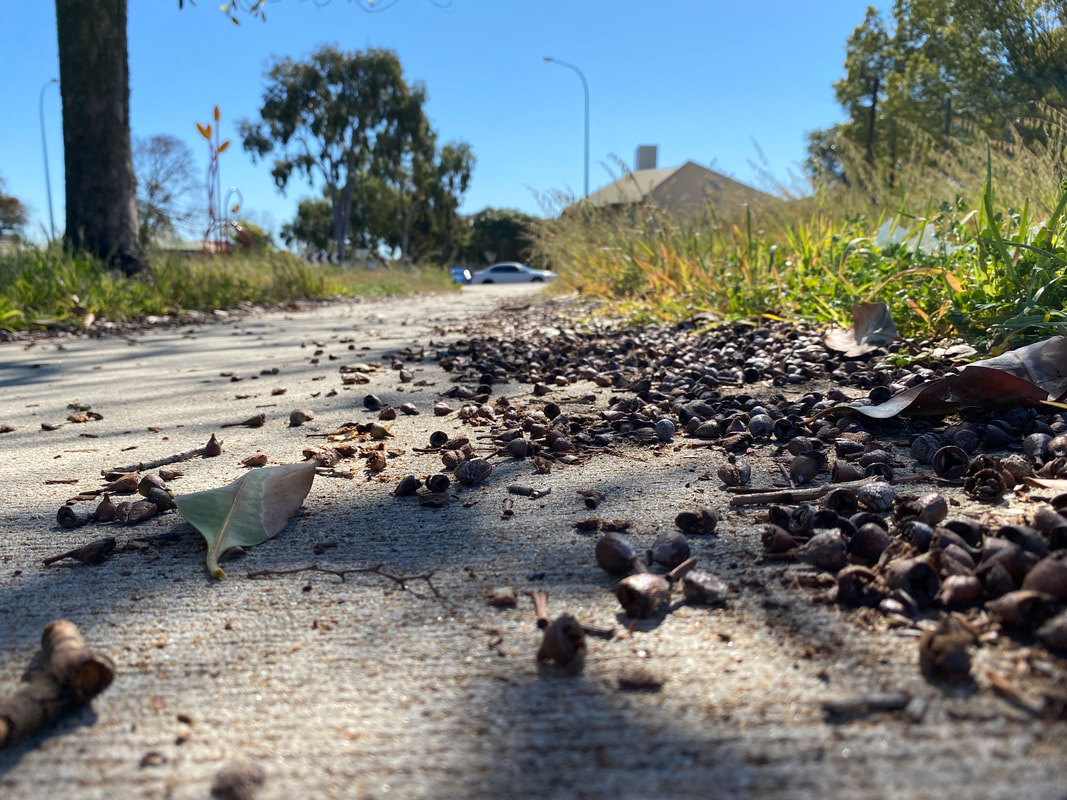 Pedestrian falls are not recorded in crash data and could be forgotten when undertaking road safety audits. Falls are, however, recorded in Hospital Admissions Data. In Western Australia this data has indicated that:
Looking out for these hazards when undertaking audits and including them in the audit report can help reduce the incidence of falls on our paths and the associated injuries, hospitalisations and fatalities. 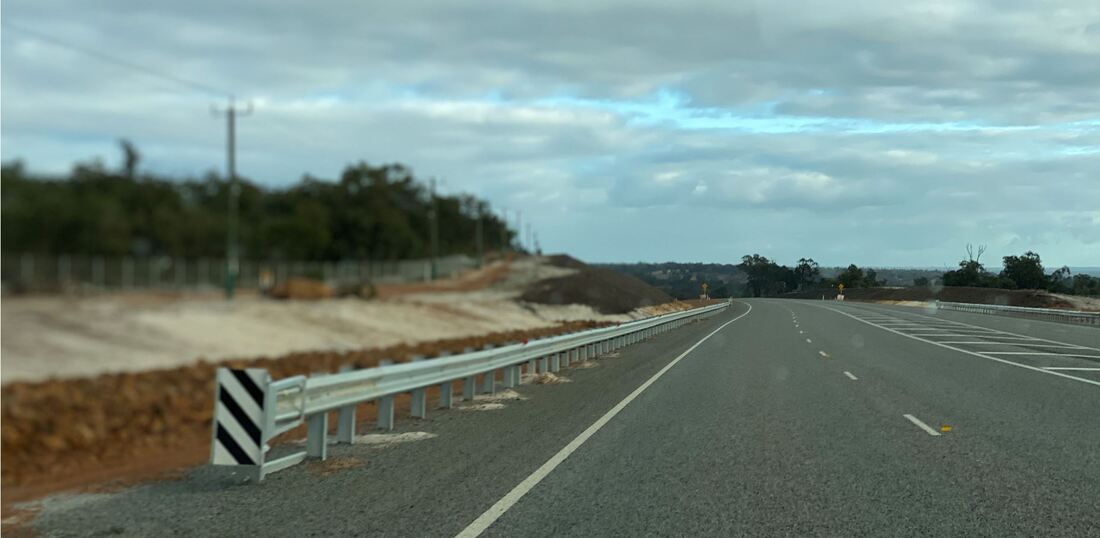 State and Federal Governments in Australia have fast-tracked major infrastructure projects to support jobs during COVID-19.
Unfortunately, I am not aware of any changes to the requirements for road safety audit teams, or site visit protocols, to enable Road Safety Audits to be undertaken in a different manner to that prescribed by the relevant road safety audit administrators in each State and Territory. I first raised this issue with the WA Road Safety Audit Panel on 23 March 2020, with a reminder on 6 April. There has not been any change to the process in this time. It is important that the Road Safety Audit process continues as this will allow for audits to be undertaken for the fast-tracked major infrastructure projects. It is also important that the Audits are undertaken in a safe manner. In recognition of the above, I recommend the following: Site Visit Changes Auditors are currently required to visit the site for all road safety audit stages, i.e. Stage 1: Feasibility, Stage 2: Preliminary Design, Stage 3: Detailed Design, Stage 4: Pre-opening and Stage 5: Roadworks. I recommend that the requirement for a physical site inspection is removed for Stage 1 and 2 audits, except for those circumstances where the Audit Team Leader has determined that it is critical. The Audit Team can use on-line aerial and satellite photographs and software to assist with Stage 1 and 2 Audits. I also recommend that the requirement for the Audit Team to visit the site for Stages 3, 4 and 5, is relaxed to allow for the Audit Team Leader to visit the site and provide the audit team members with Dash-cam video when driving, body-cam video when walking or riding and GPS coded photographs taken during the site visit. The video should include narrative from the Audit Team Leader. Where it is deemed essential for an Audit Team to inspect the site, the team should be limited to the Audit Team Leader (an accredited Senior Auditor) and an accredited Auditor. Key Personnel All Senior Road Safety Auditors should be classified as “Specialist required for Industry” and permitted to travel to and from sites on this basis. Request the change I urge all Road Safety Auditors to contact the relevant authorities in their Sate or Territory, or local member of Parliament, to get these changes through as soon as possible so that we can continue to work together to provide a safer road network. The National Road Safety Strategy is based on the Safe System approach to improving road safety. This involves a holistic view of the road transport system and the interactions among roads and roadsides, travel speeds, vehicles and road users. It is an inclusive approach that caters for all groups using the road system, including drivers, motorcyclists, passengers, pedestrians, cyclists, and commercial and heavy vehicle drivers. Consistent with our long-term road safety vision, it recognises that people will always make mistakes and may have road crashes—but the system should be forgiving and those crashes should not result in death or serious injury. Key inputs to the Safe System are:
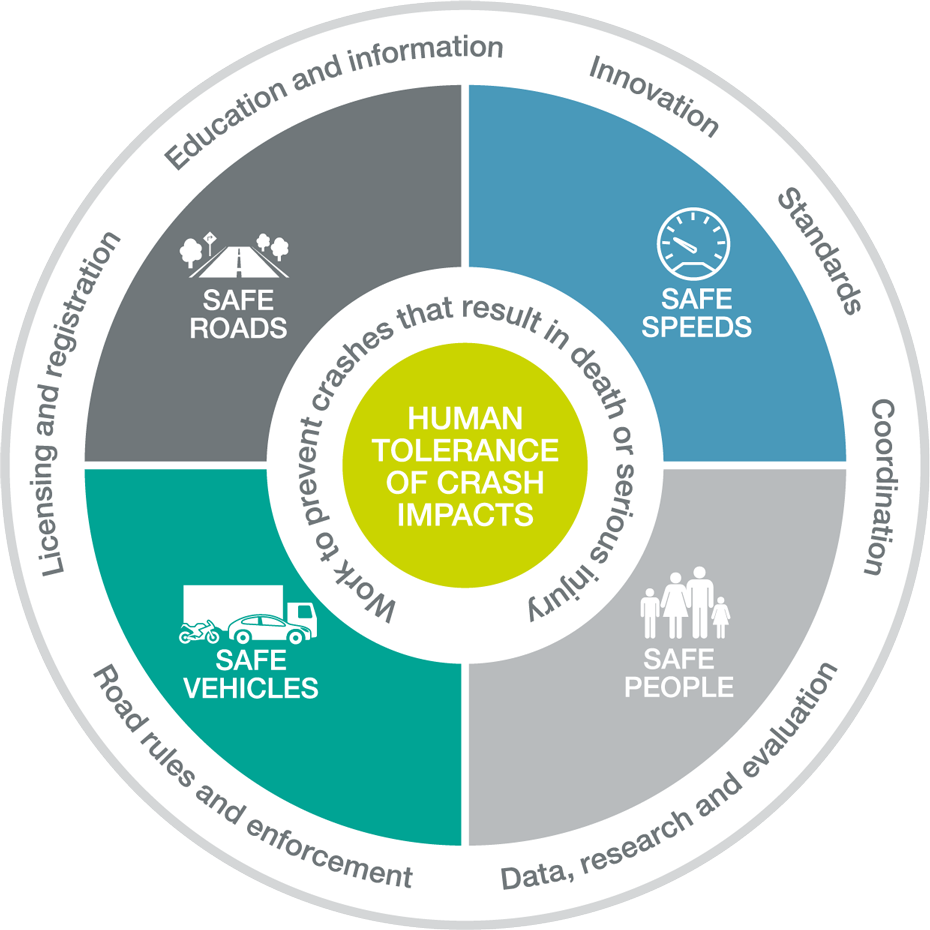 Safe system diagram adapted from Safer Roads, Safer Queensland: Queensland's Road Safety Strategy 2015–21 The Safe System approach was adopted in Australia during the period of the previous national strategy, through the National Road Safety Action Plans and the strategies of individual states and territories. It is consistent with the approaches adopted by the safest countries in the world, and is a central theme of the landmark OECD report Towards Zero: Ambitious road safety targets and the safe system approach, published in 2008. There are several guiding principles to this approach:
Shared responsibilityWhile individual road users are expected to be responsible for complying with traffic laws and behaving in a safe manner, it can no longer be assumed that the burden of road safety responsibility simply rests with the individual road user. Many organisations—the ‘system managers’—have a primary responsibility to provide a safe operating environment for road users. They include the government and industry organisations that design, build, maintain and regulate roads and vehicles. These and a range of other parties which are involved in the performance of the road transport system and the way roads and roadsides are used, all have responsibility for ensuring that the system is forgiving when people make mistakes.
Road safety responsibilities also extend to various professional groups, as well as the broader community. For example: health professionals have a role in helping their clients to manage their safety on the roads; and parents contribute significantly to the road safety education of their children—not only through their direct supervision of learner drivers, but also by modelling their own driving and road user behaviour. 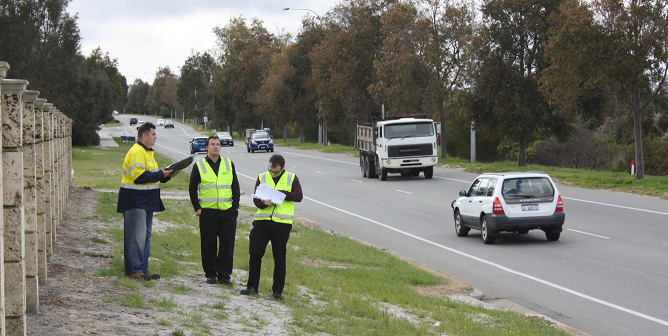 What better way to celebrate completing my 200th Road Safety Audit as a Senior Road Safety Auditor Team Leader than starting my 201st yesterday on Pinjar Road in Wanneroo. A big thank you to Ryan Bettridge from Perth Traffic Training, Benjamin Hawkins from ATM and Aaron Lee from the City of Wanneroo for volunteering time to be a part of this audit. Observing a roadside memorial for a 6 year old boy on site brings home the importance of the work that these guys do.
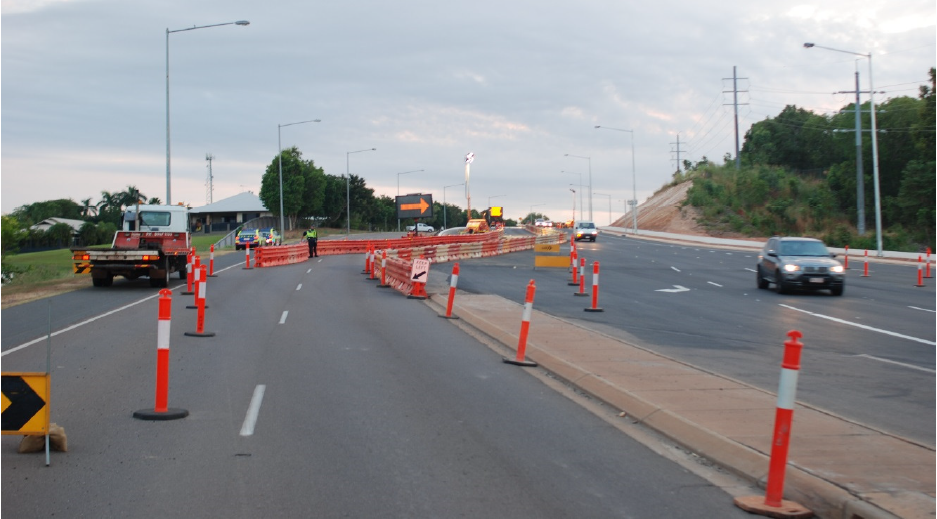 The Northern Territory's coroner believes offences were committed regarding the faulty set-up of a traffic diversion that led to the death of a well-known Darwin musician, and has referred the matter to the police commissioner and the director of public prosecutions.
It is worth noting that despite the motorcyclist being found to have a blood alcohol level of 0.204% and a high level of cannabis in his system, the coroner concluded that the poor traffic management set up was a contributing factor to the rider’s death. The Coroner stated: ‘I believe that offences may have been committed in connection with the death of Peter John Bonnell and in accordance with section 35(3) I report my belief to the Commissioner of Police and the Director of Public Prosecutions.’ A full copy of the Coroner's report can be accessed at https://justice.nt.gov.au/__data/assets/pdf_file/0007/474712/D00792016-Peter-Bonnell.pdf I encourage all those involved in the design, implementation, review and auditing of temporary traffic management to read this report. Cambridgeshire County Council has been awarded £550,000 by the Department for Transport (DfT), United Kingdom to create the UK’s first Dutch-style roundabout at Fendon Road and Queen Edith’s Way in Cambridge. The new roundabout scheme will improve safety in the area by giving priority to pedestrians and cyclists over motorists. The Council secured the funding after submitting a proposal to the DfT in February this year, in a bid to win part of the £7 million capital funding allocated by the Government for the 2018-19 Cycle City Ambition Safety programme. 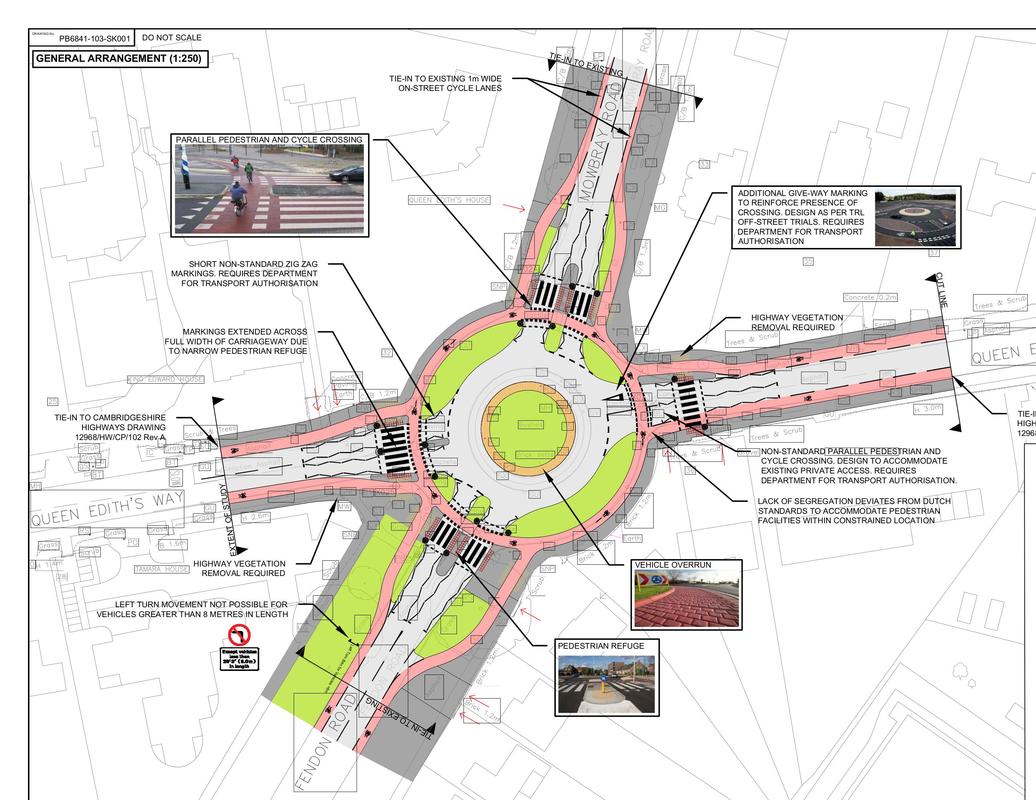 What is a Dutch-style roundabout?
The Dutch-style roundabout design for Fendon Road in Cambridge will seek to improve safety for cyclists and pedestrians in a number of ways. One of the key elements is a change in carriageway width, designed to influence slower approach and departure speeds, thereby reducing the speed of drivers. Larger or longer vehicles have to partially use an overunnable strip in the centre of the road, which causes these drivers in particular to travel very slowly through the junction. With speeds reduced, any accidents that do occur are likely to be of much lower severity. Pedestrians will be provided with zebra crossings on each of the four roundabout entry/exit arms, and cyclists will be given their own cycle path, in contrasting red tarmac, to give them equal priority with pedestrians over each arm. 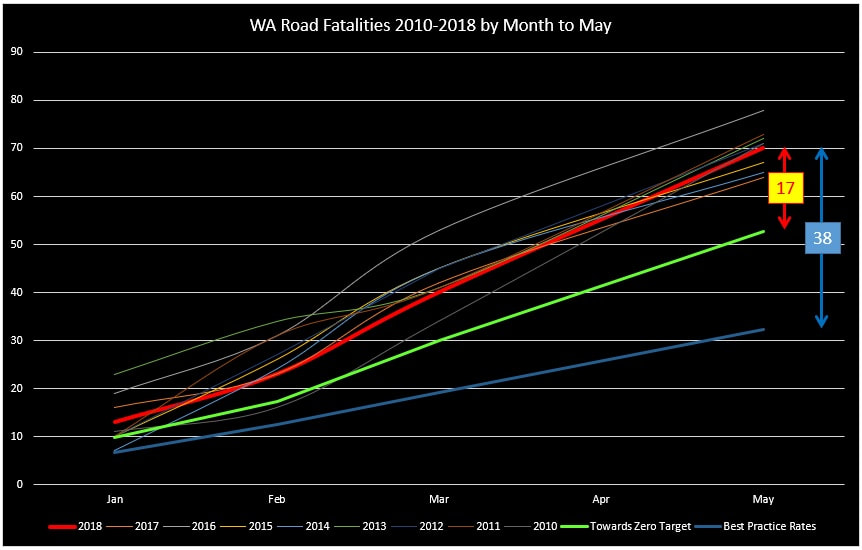 70 people have died on WA roads since January this year. That's 17 more than the WA Government's own strategy target and 38 more than what could be achieved through best practice.
In March 2009 the WA Government set itself a target of reducing the number of people killed and seriously injured on WA roads by "a reduction of up to 40 per cent on the average number of people killed and seriously injured each year between 2005 and 2007." This target was included in the 'Towards Zero Strategy'. The Towards Zero Strategy target is well below best practice rates achieved in western countries but is seen as a positive step in reducing road trauma in WA. Sadly, we are missing both targets and WA continues to experience one of the worst road safety records in Australia. To achieve a significant change we need a significant change in how we tackle the issue. We can't keep blaming drivers. We must adopt and implement the same strategies that have been implemented by those countries with an excellent road safety record. Blaming drivers and the different road environments in Australia is an excuse, not a strategy. The Federal Government and the WA Government have adopted the best practice "Safe System" principle. We need to implement this to stop more deaths in a month on WA roads than by sharks in 10 years off the WA coast.  EA Matters May 2018 Case Study
Recently the Chair and members of the Transport Australia Society WA committee wrote to the Road Safety Commissioner about how to improve road safety for the community. As a result of the letter EA representatives (including David Wilkins from i3 consultants WA) met with WA’s road safety commissioner, Iain Cameron, as well as representatives from his office and Main Roads WA. As a result, the commissioner is keen to work with Engineers Australia to develop the next road safety strategy for the State. It was particularly pleasing to hear the commissioner saying how vital it is that the road safety engineering leadership voice is heard and that engineering leadership is critical for the paradigm shift to a safe system. There were 23 reported road deaths in WA in 2018 as at 1st March. This is 7 more than were reported in 2010. If we had the same fatality rate as the best performing European Countries there would have been 10 less deaths and scores of less serious injuries on our roads. We need those in charge to say enough is enough and commit to implementing significant changes. 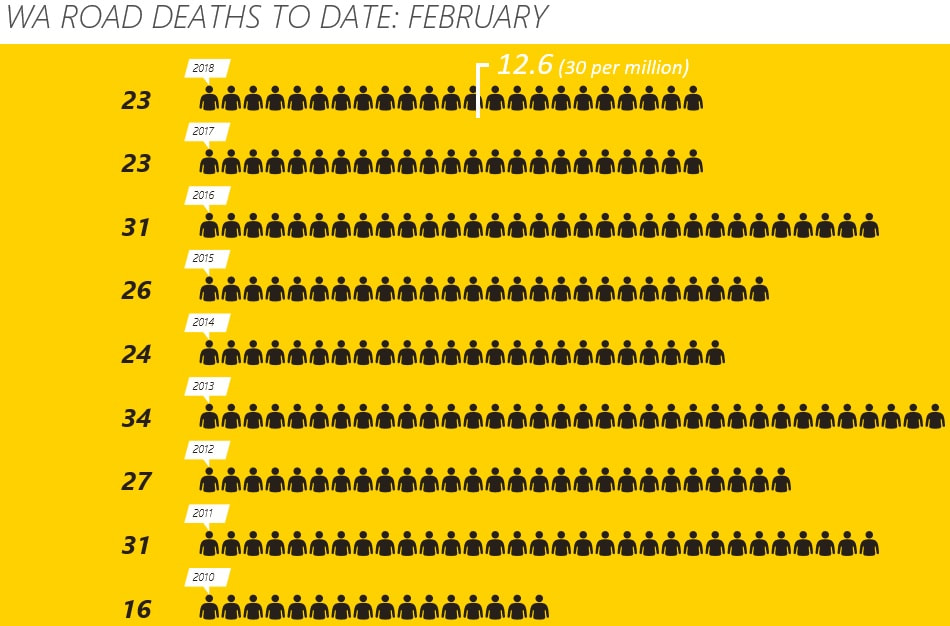 |
AuthorDavid Wilkins, Principal & Senior Traffic Engineer. Archives
August 2023
Categories
All
|
 RSS Feed